
- Potential consumers decide what to buy based on a bunch of factors (price, tastes, information, the price of other goods, income, government actions etc.)
- Although many factors influence demand, economists usually concentrate on how price affects the quantity demanded.
The Demand Curve
- The amount of a good that consumers are willing to buy at a given price, holding constant other factors that influence purchases, is the quantity demanded.
- The quantity demanded of a good or service can exceed the quantity actually sold.
- We can show the relationship between price and the quantity demanded on a graph:
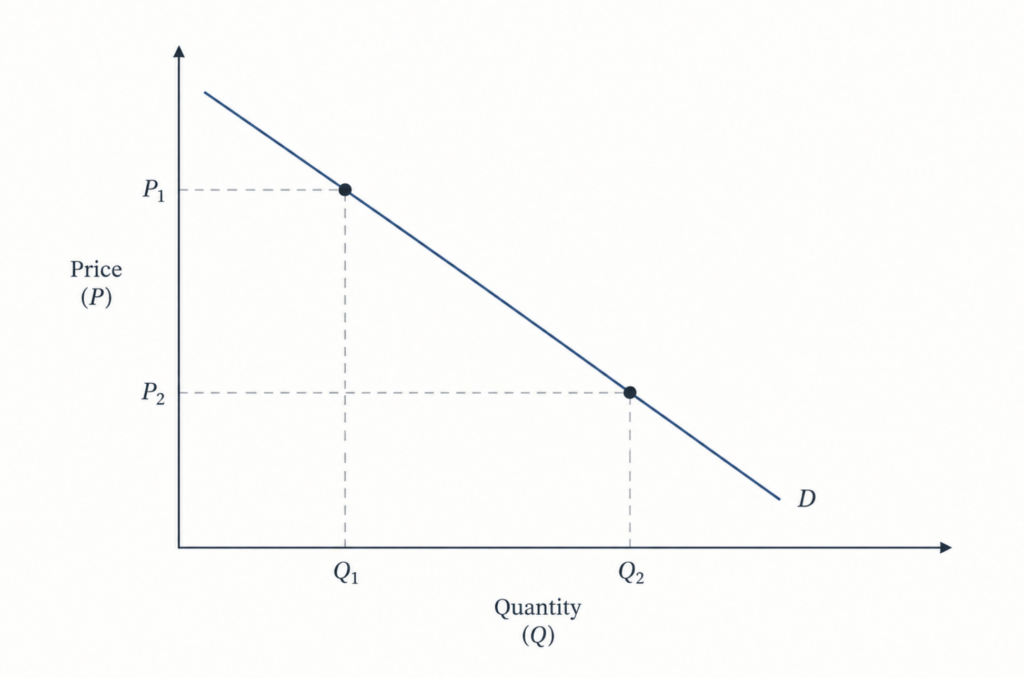
- A demand curve shows ow quantity demanded changes as the price changes, holding constant other factors that influence purchases (e.g. income, prices of other goods, consumer taste, information, etc).
- Although this demand curve is straight, they can be curved or wavy too.
Effects on Prices on the Quantity Demanded
Law of Demand
Consumers demand more of a good the lower its price, holding constant other factors that influence the mount they consume. That’s why demand curves slope down.
- A curve that slopes down shows people demand more of a good when it’s cheap and less of it when it’s expensive.
Effects of Other Factors on Demand
- If demand curves only show the effect of price changes (and no other factors), how can we use demand curves to show changes in demand based on one of these other factors (like change in household income)?
- A change in any factor other than the good’s price causes a shift of the demand curve, rather than a movement along the demand curve.
- E.g. if household income goes up and the price of coffee stays the same, more people will buy coffee – so demand increases even though price stayed the same.
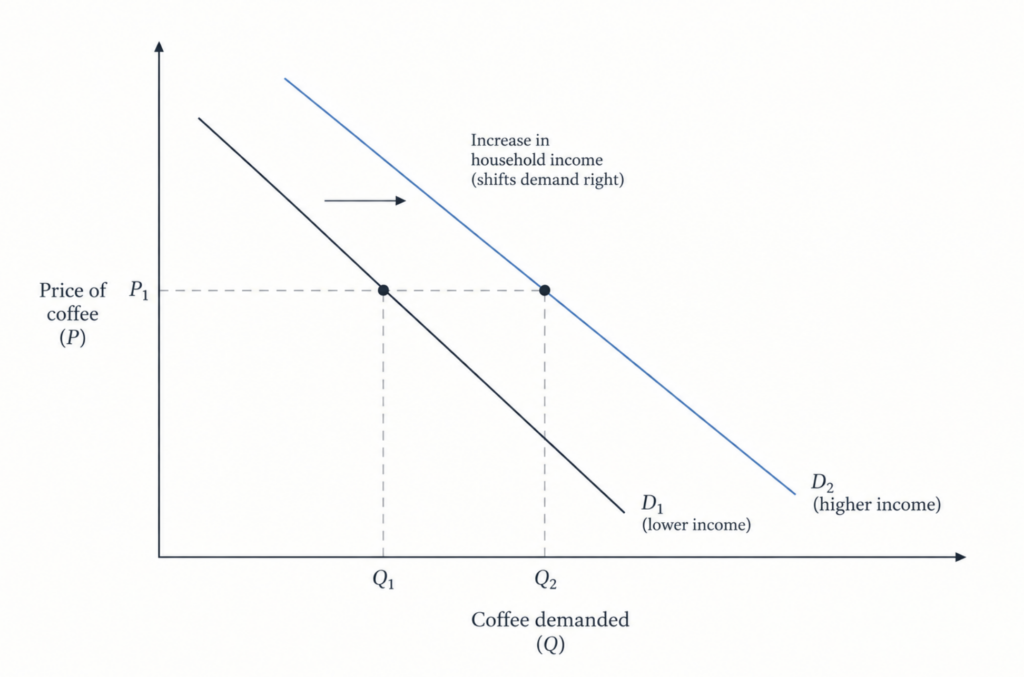
- A change in the price of substitutes or complements may also cause the demand curve to shift.
- Substitute goods/services: goods/services people will happily buy instead of the other good/service e.g. tea is often seen as a substitute for coffee. So if the price of tea decreases, demand for coffee may go down (i.e. coffee’s demand curve would shift left).
- Complement goods/services: goods/services that are often consumed together e.g. coffee and sugar. So if the price of sugar went up potentially the demand for coffee would go down (i.e. coffee’s demand curve would shift left).
The Demand Function
- The demand function is a formula that shows the relationship between demand, price and other factors that influence a consumer’s buying decision (e.g. income, substitutes, complements, tastes etc.).
- So while we use a graph to show the effects of changing one of these other factors by shifting the demand curve (see above) we can also use maths to show the same information.
- In short, the demand function shows the effect of all the relevant factors on the quantity demanded.
- For example: the quantity of coffee demanded (Q) will change depending on the price of coffee (p), the price of sugar (ps) and consumer income (Y). So the demand function (D) would look like this:
- But this formula right now is just a general function form – it just tells us that the quantity of coffee demanded (Q) depends on the inputs inside the parentheses.
- So we can make this general form equation into a specific (linear) form like this, for example:
- In a standard demand curve we hold the price of sugar (ps) and consumer income (Y) at specific values, so they don’t influence demand as price changes. But, with this equation these factors can influence the demand.
- E.g. if we say that the price of sugar per lb (ps) is $0.20 and the annual household income (Y) is $35,000, we can then write the quantity demanded as a function of just the price of coffee (p)
- Using our simplified demand equation (Q = 12 – p), we can analyse a movement along the demand curve caused purely by a price change.
- To express change, we use the Greek symbol Δ (delta), which means “change in”:
- Δp= p2 – p1 (change in price)
- ΔQ= Q2 -Q1 (change in quantity demanded)
- E.g. if the price of coffee falls from p1=$4 to p2=$2, price changes by Δp = $2 – $4 = -$2 (a $2 price drop). And lets say quantity demanded increases from Q1=8 to Q2=10, changing by ΔQ = 10 – 8 = 2 million tons of coffee per year
- We can derive this relationship algebraically for any price change using our demand function:
- This proves that ΔQ = -Δp: the change in quantity demanded is always −1 times the change in price, directly supporting the Law of Demand.
- For example, if p = -$2, then Q = -p = -(-2) = 2 million tons per year. A $2 decrease in price causes an increase in quantity demanded of 2 million tons per year. Similarly, raising the price would cause the quantity demanded to fall.
- We can also calculate the slope of the demand curve using rise/run (vertical change in price divided by horizontal change in quantity, or Δp/ΔQ):
- The negative slope confirms that price and quantity move in opposite directions – raising the price by $1 per lb causes quantity demanded to drop by 1 million tons per year.